Implementing Fuzzy Logic on ESP32 for Weight Anomaly Detection in Smart Shelf Systems

Detecting abnormal item removal in automated storage systems requires more than simple threshold comparison. In the Smart Shoes Shelves System, a fuzzy logic-based weight monitoring algorithm was implemented on ESP32 to improve anomaly detection accuracy.

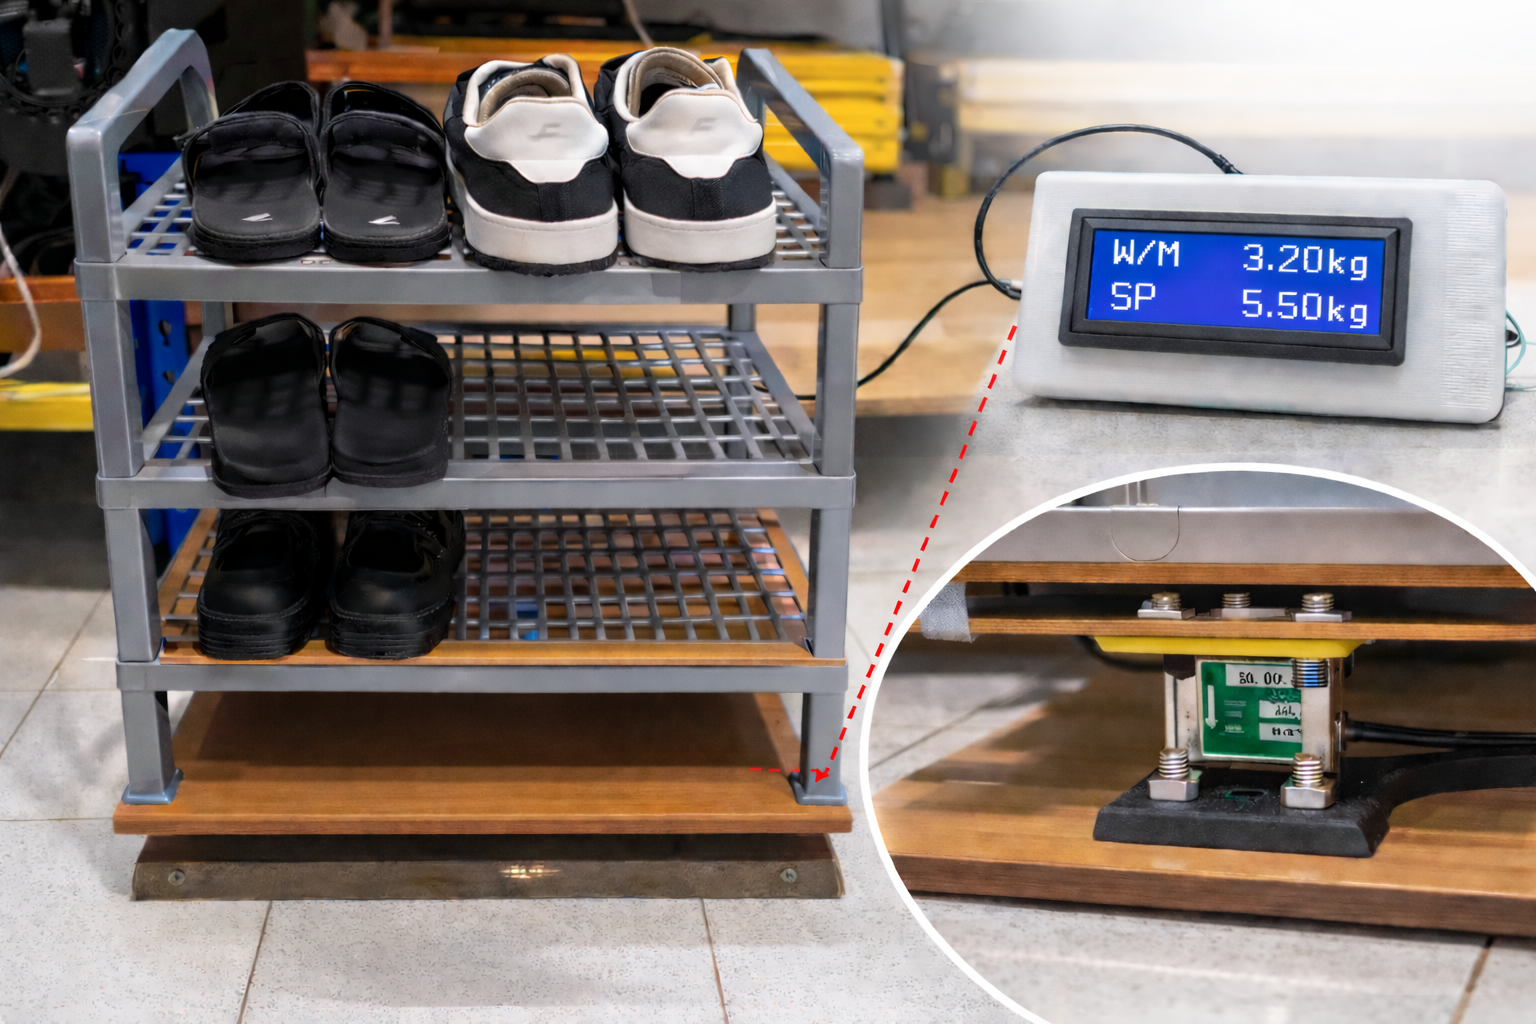
Figure 3 – Mechanical smart shelf structure integrated with load cell-based weight monitori.png

Unlike conventional systems that trigger alarms when weight drops below a fixed limit, this design evaluates both weight deviation and rate of change to reduce false positives caused by vibration, gradual handling, or sensor noise.

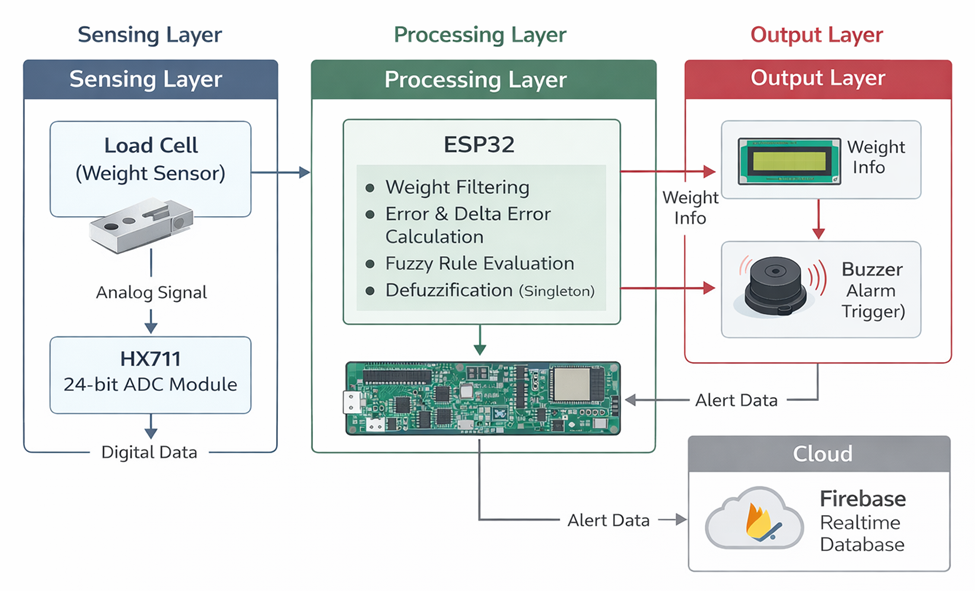
System Architecture Overview

image.png

The hardware consists of:

  • ESP32 microcontroller
  • Load cell sensor
  • HX711 24-bit ADC amplifier
  • LCD 16x2 I2C
  • Buzzer alarm
  • Firebase integration

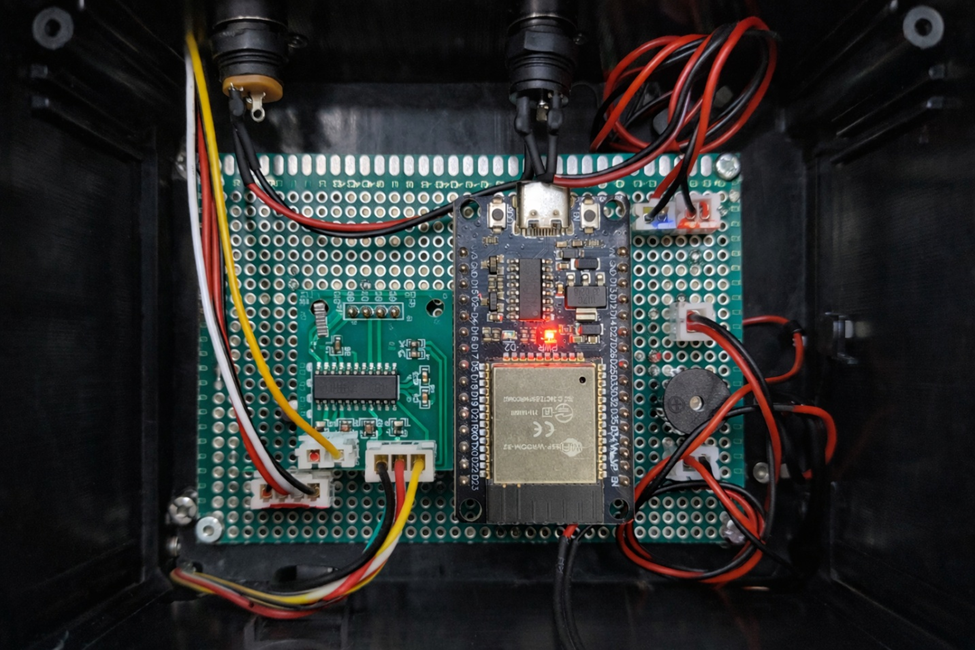
The board layout and component placement are shown in the Board Details section, highlighting integration between sensor input, LCD interface, and ESP32 core processing.

image.png

The system continuously measures weight (Present Value / PV) and compares it to a stored setpoint (SP).

Mathematical Foundation

The fuzzy system is based on two input variables:

Error:

image.png

Delta Error:

image.png

Where:

  • SP = Setpoint weight
  • PV = Current measured weight
  • ΔE = Rate of weight change

This allows detection of sudden removal events versus gradual user interaction.

Membership Function Design & Rule Base Implementation

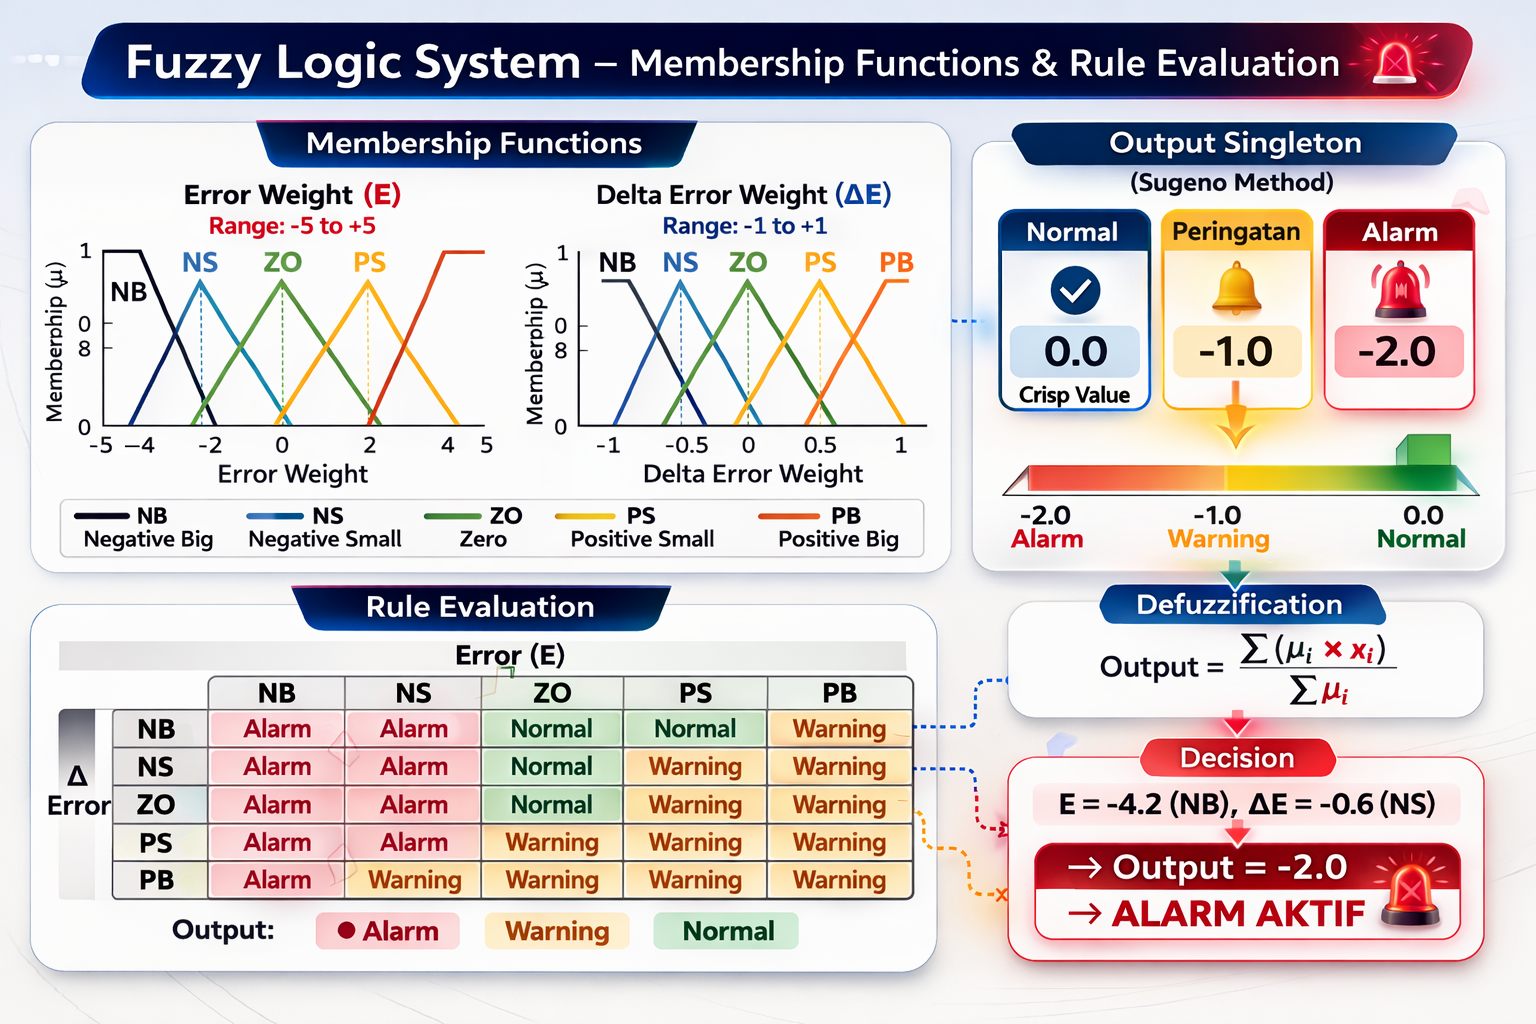
Error membership sets:

  • NB (Negative Big)
  • NS (Negative Small)
  • ZO (Zero)
  • PS (Positive Small)
  • PB (Positive Big)

Delta Error membership sets:

  • NB
  • NS
  • ZO
  • PS
  • PB

The interval resolution used:

  • Error interval = 0.5
  • Delta error interval = 0.2

Triangular membership functions were used for smooth transitions between states.

This prevents rigid decision boundaries.

Figure 5 – Fuzzy rule evaluation matrix defining system output behavior..png

The rule evaluation matrix defines output behavior:

Output categories:

  • Normal
  • Warning + Notification
  • Alarm & Notifications

Example rule:

IF Error = NB

AND Delta Error = NB

THEN Output = Alarm & Notification

This rule detects sudden significant weight removal.

Defuzzification is implemented using a singleton method with output values:

  • 0 → Normal
  • -1 → Warning
  • -2 → Alarm

Firmware Implementation on ESP32

image.png

Implementation steps:

  1. Read HX711 value
  2. Apply filtering (moving average)
  3. Compute error and delta error
  4. Calculate membership degrees
  5. Evaluate fuzzy rules
  6. Compute weighted output
  7. Trigger buzzer and Firebase alert

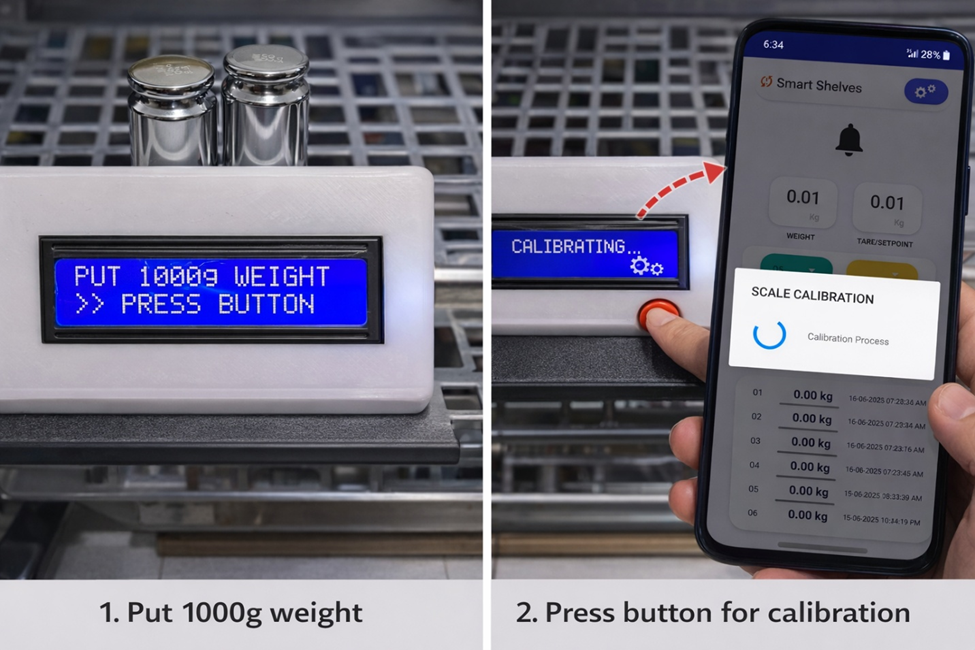
The calibration process ensures accurate weight measurement before fuzzy evaluation begins.

System Behavior

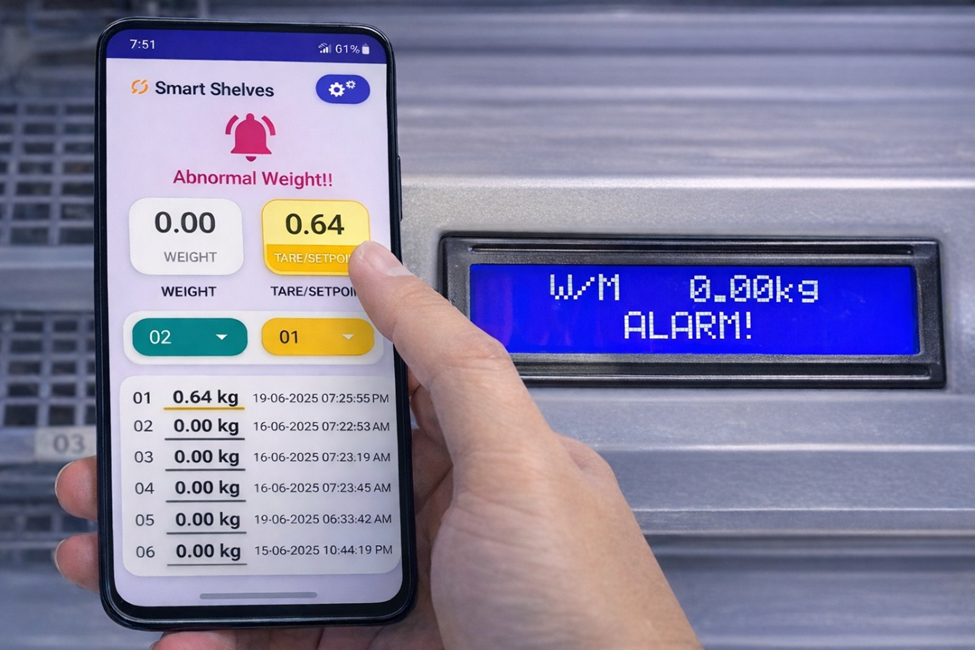
When a correct item is removed through the application interface, the setpoint is updated dynamically.

image.png

However, if weight changes without proper command sequence, the fuzzy engine evaluates the anomaly and activates the alarm state.

This dynamic adaptation significantly reduces false alarms compared to static threshold methods.

Engineering Insight

The integration of fuzzy logic into an embedded IoT platform demonstrates how lightweight AI techniques can enhance reliability in real-world systems.

Instead of binary logic, the system operates using graded decision-making, making it more robust against:

  • Mechanical vibration
  • Sensor drift
  • Gradual load changes
  • Minor noise fluctuation

This approach bridges classical embedded programming with intelligent decision systems, suitable for smart inventory, anti-theft storage, and automated monitoring environments.

#AI# #Fuzzy# #Embedded#

IoT Project
Designing a Multi-Socket IoT Energy Monitoring and Control System

Expanding from a single-socket prototype to a multi-socket IoT energy monitoring system introduces significant architectural and safety challenges. In this version, the system supports four independent AC outputs, each equipped with its own energy measurement and control channel.

This transition required redesigning both the hardware layout and firmware structure to maintain stability, isolation, and scalability.

System Architecture Overview

image.png

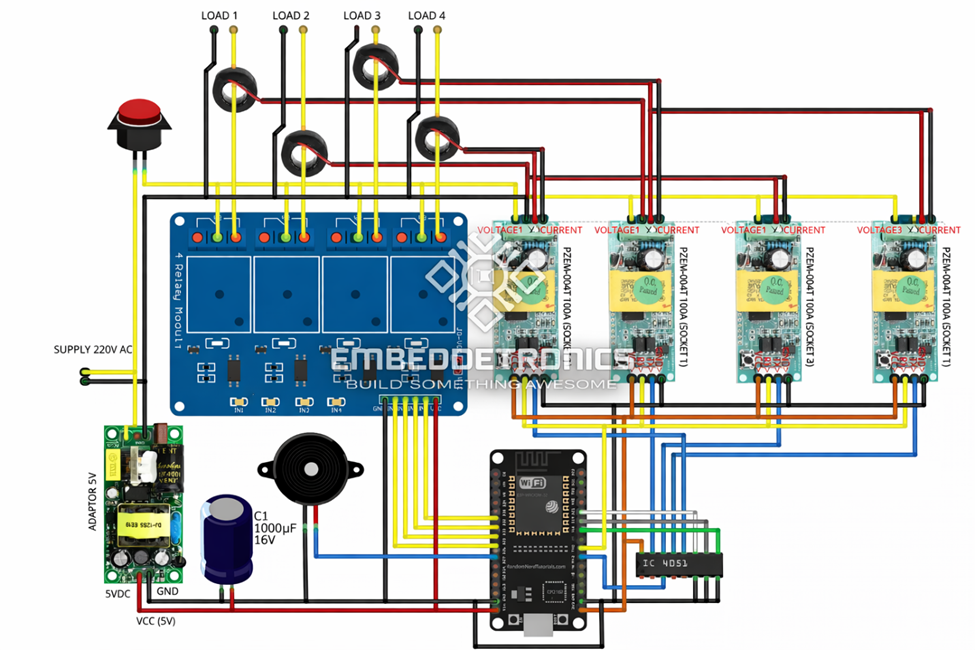
The multi-socket version integrates:

  • ESP32 as central controller
  • Four PZEM-004T energy modules
  • 4-channel relay module
  • IC 4051 multiplexer
  • 220VAC to 5V switching power supply
  • Firebase Realtime Database integration

image.png

The complete wiring structure is shown in the wiring diagram, where each load channel is measured independently and routed through its own relay.

Independent Channel Design

Each socket includes:

  • Dedicated current transformers
  • Independent voltage measurement
  • Separate energy accumulation
  • Individual alert threshold

The firmware stores data in structured nodes:

device1/socket1/voltage

device1/socket2/voltage

device1/socket3/voltage

device1/socket4/voltage

This ensures per-load monitoring and simplifies cloud-side analysis.

Hardware Layout and Isolation

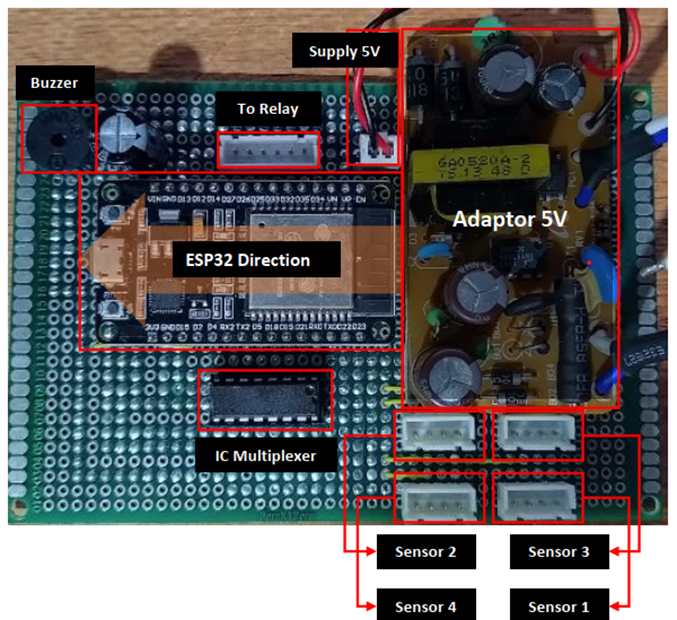
Figure 2 – Internal board layout showing ESP32, multiplexer, relay module, and 5V power supply..png

From the board layout, several critical design considerations can be observed:

  • Clear separation between AC high-voltage section and low-voltage logic section
  • Dedicated 5V supply module for ESP32 and relay drivers
  • Use of IC multiplexer (4051) to manage multiple measurement inputs
  • Relay driver isolation to protect GPIO pins

When multiple relays operate simultaneously, switching noise increases significantly. To mitigate this:

  • Decoupling capacitors are placed near ESP32 supply lines
  • Proper grounding strategy is implemented
  • Relay flyback protection is included

These measures prevent ADC instability and WiFi communication drops.

Panel and Mechanical Design

Figure 3 – Mechanical enclosure with four independent AC output sockets.png

The enclosure layout demonstrates practical installation considerations:

  • Four front-access sockets
  • Dedicated AC input connector
  • Master ON/OFF switch
  • Internal spacing for airflow

Thermal management becomes important when multiple loads operate simultaneously. Proper cable routing and spacing reduce overheating risk.

Firmware Scaling Strategy

The firmware was redesigned using channel abstraction rather than duplicating logic.

Instead of writing separate code blocks per socket, a structured array approach is used:

  • Measurement array per channel
  • Alert threshold per channel
  • Relay status per channel

Sampling is performed sequentially to avoid communication congestion.

This approach improves maintainability and enables future expansion beyond four sockets.

Cloud Synchronization Model

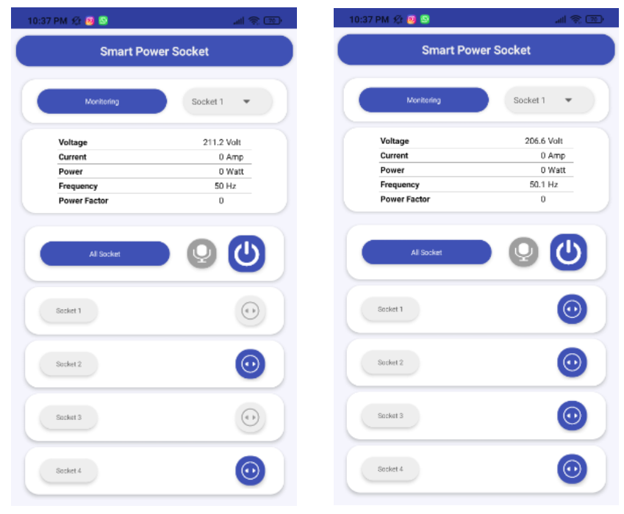
Figure 4 – Android interface displaying real-time monitoring per socket.png

Firebase integration allows each socket to publish:

  • Voltage
  • Current
  • Power
  • Energy
  • Cost
  • Alert flag

The Android interface displays real-time data per socket.

This architecture supports:

  • Per-load monitoring
  • Independent billing estimation
  • Remote supervision
  • Scalable IoT deployment

Design Lessons

Moving to multi-channel AC monitoring significantly increases complexity in:

  • Electrical safety
  • Signal integrity
  • EMI handling
  • Thermal management
  • Firmware modularity

A scalable IoT energy system must be designed with isolation, noise control, and structured data handling from the beginning.

This multi-socket implementation represents the evolution from a simple monitoring prototype into a structured smart power management platform suitable for laboratory, workshop, or small industrial applications.

#power meter#

#internetofthings# #Embedded#

IoT Project
Comparing IoT Platforms for kWh Energy Monitoring: Firebase vs Telegram vs Blynk

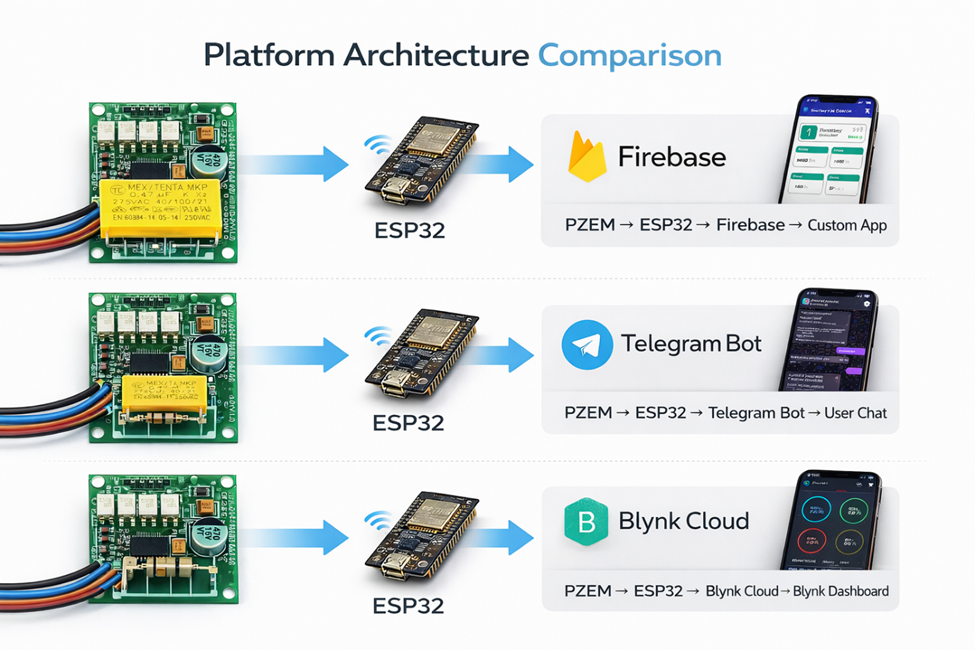
After implementing the core hardware and firmware for the IoT-based kWh monitoring system, the next major challenge was selecting the most suitable cloud and user interaction platform. Over several iterations, I tested three different approaches: Firebase Realtime Database, Telegram Bot integration, and Blynk IoT dashboard.

Each platform offers distinct advantages and trade-offs depending on system requirements, scalability, and deployment environment.

image.png

1. Firebase Realtime Database

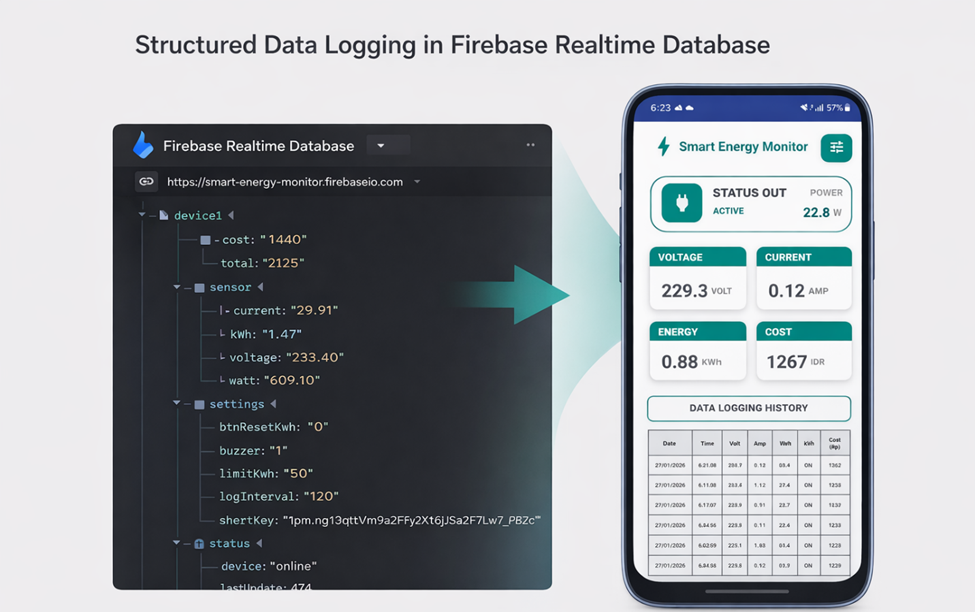
image.png

Firebase was used as a structured cloud backend for real-time data synchronization.

Strengths:

  • Structured JSON-based database
  • Real-time synchronization
  • Scalable for multiple devices
  • Suitable for custom Android applications

Firebase allows clean separation between measurement logic and cloud storage. Data such as voltage, current, power, energy, cost, and alert flags can be stored in a hierarchical tree structure.

Because it operates over HTTPS, it provides relatively secure communication. It is well-suited for systems requiring long-term historical logging and structured data management.

Limitations:

  • Requires database configuration
  • Requires authentication token handling
  • Slightly more complex setup

Firebase is ideal when building a structured IoT ecosystem with custom front-end applications.

2. Telegram Bot with Google Sheets Logging

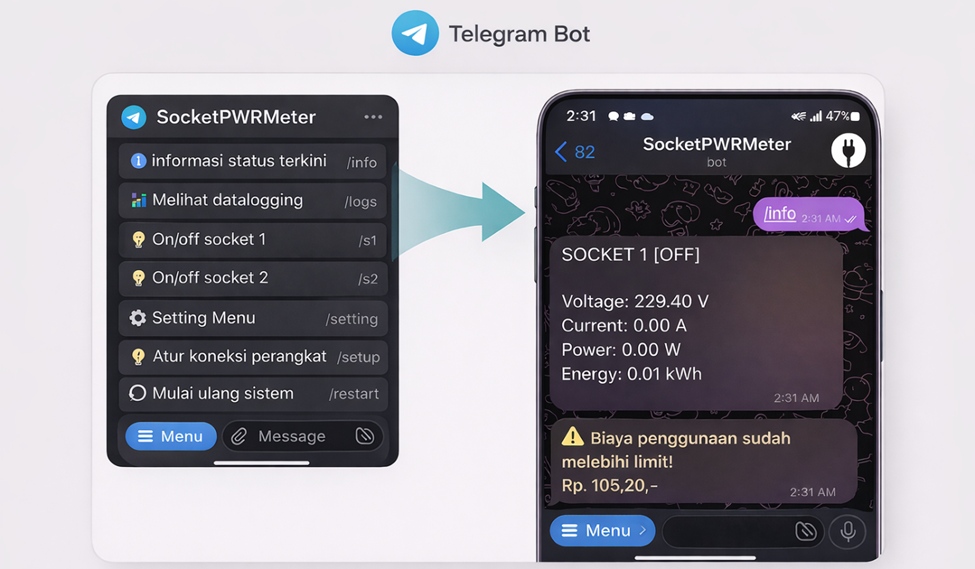
image.png

The Telegram version focuses on command-based monitoring and notification.

Strengths:

  • No dedicated mobile app required
  • Simple user interaction via chat commands
  • Easy alert notification
  • Google Sheets integration for logging

Users can send commands such as /info or /logs to retrieve real-time energy data. When energy thresholds are exceeded, instant notifications can be sent automatically.

Google Sheets integration provides simple historical logging without complex database setup.

Limitations:

  • Less structured compared to Firebase
  • Command-based interaction is less visual
  • Dependent on Telegram server availability

This approach is effective for lightweight monitoring systems or quick deployment scenarios.

3. Blynk IoT Dashboard

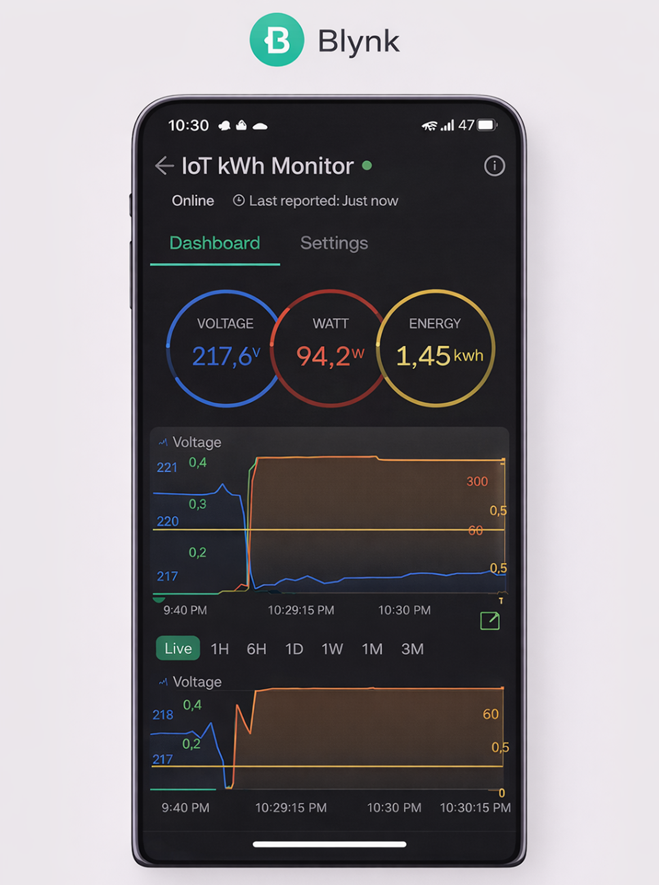
image.png

Blynk provides a graphical dashboard interface for IoT devices.

Strengths:

  • Real-time graphical widgets
  • Built-in notifications
  • Minimal backend setup
  • User-friendly mobile interface

It allows fast visualization of voltage, current, power, and energy values using gauges and charts.

Limitations:

  • Dependency on third-party platform
  • Limited customization compared to full backend control
  • Long-term scalability may require subscription plans

Blynk is suitable for rapid prototyping and demonstration purposes.

4. Technical Comparison Summary

From an engineering perspective:

  • Firebase provides structured and scalable backend control.
  • Telegram offers simplicity and direct notification capability.
  • Blynk emphasizes user-friendly visualization.

For long-term deployment and multi-device systems, Firebase is the most flexible. For alert-based monitoring, Telegram is efficient. For quick UI development, Blynk is practical.

5. Technical Comparison Table

Feature Firebase Realtime DB Telegram + Google Sheet Blynk IoT
Data Structure Hierarchical JSON Flat log-based Widget-based
Real-Time Update Yes On request / event-based Yes
Historical Logging Full database Google Sheets logging Limited / dashboard-based
Alert Notification Via cloud logic Direct chat notification Built-in notification
UI Customization Fully customizable (custom app) Command-based Predefined widgets
Setup Complexity Medium–High Medium Low
Scalability High Medium Medium
Platform Dependency Google Firebase Telegram + Google Blynk Cloud
Suitable For Structured IoT systems Lightweight alert system Rapid prototyping & demo

6. Final Insight

Selecting an IoT platform is not purely a technical decision; it depends on the balance between control, scalability, simplicity, and maintenance.

Through iterative development, this kWh monitoring system evolved from simple remote display to a modular IoT architecture capable of adapting to different cloud ecosystems without modifying the core energy calculation firmware.

#Embedded# #ESP32# #iot# #internetofthings# #firebase# #android# #telegram# #blynk#

IoT Project
Implementing Energy Calculation and Data Logging on ESP32 for IoT kWh Monitoring

After completing the hardware architecture of the single-socket IoT energy meter, the next critical stage was implementing reliable energy calculation and data handling on the ESP32.

Unlike simple voltage or current monitoring, a kWh system must continuously compute power and accumulate energy over time. This requires careful handling of sampling intervals, communication reliability, and data persistence.
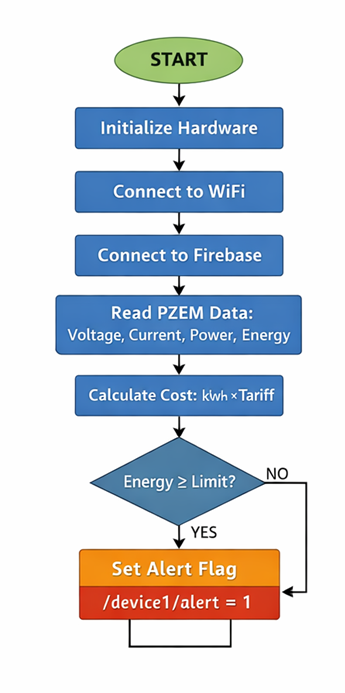
image.png

Reading Electrical Parameters

The system uses the PZEM-004T module to obtain:

  • Voltage (V)
  • Current (A)
  • Active Power (W)
  • Energy (kWh)
  • Frequency (Hz)

Communication between ESP32 and PZEM is handled via UART.
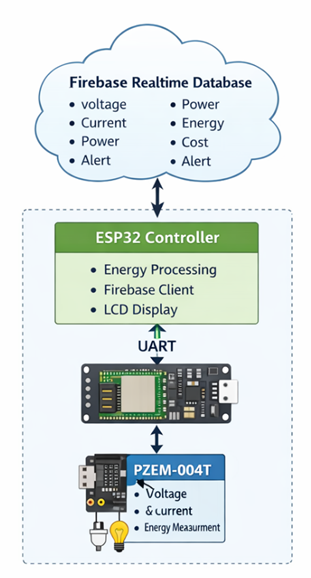
image.png

A periodic polling method is implemented to read data every defined interval (typically 1–2 seconds).

To avoid unstable readings:

  • Invalid responses are filtered
  • Communication timeout is monitored
  • Re-read attempts are implemented if data is corrupted

This ensures stable long-term monitoring.

Energy Accumulation Strategy

Although the PZEM module provides accumulated energy internally, I implemented additional logic on the ESP32 for:

  • Energy reset functionality
  • Session-based energy tracking
  • Cost calculation (based on Rp/kWh tariff)

Energy cost is calculated using:

Cost = Energy (kWh) × Tariff (Rp/kWh)
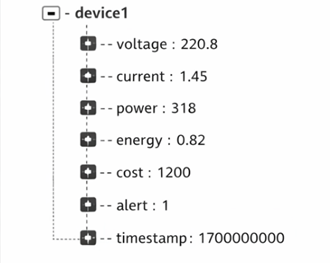
image.png

The tariff value can be configured remotely depending on the electricity pricing scheme.

WiFi Connectivity Handling

Because the device operates in real environments, WiFi stability cannot be assumed.

The firmware includes:

  • Auto-reconnect routine
  • Offline detection (fallback to local LCD monitoring)
  • Timeout-based retry logic

If WiFi is unavailable for a defined period, the system continues measuring locally and resumes cloud synchronization once the connection is restored.

Data Logging Architecture
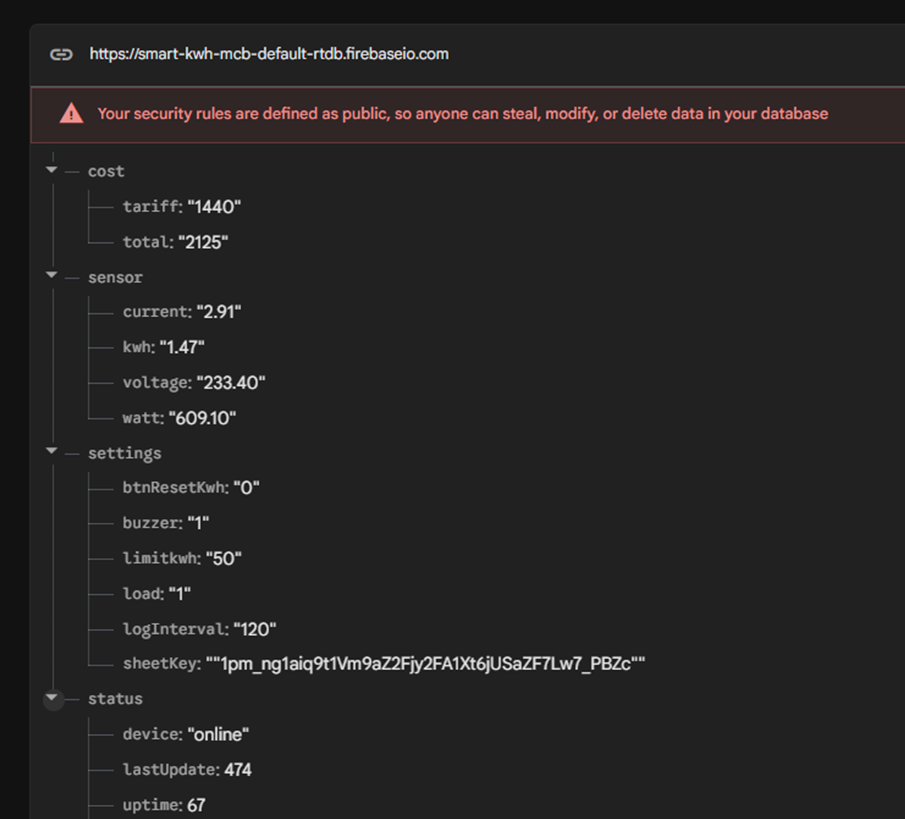
image.png

All measurement data is transmitted to Firebase Realtime Database using HTTPS-based secure communication.

The structured data tree includes:

  • voltage
  • current
  • power
  • energy
  • cost
  • alert
  • timestamp

Each measurement cycle updates the corresponding fields in the database. Separating measurement logic from communication logic ensures modular firmware design.

This architecture allows:

  • Real-time remote monitoring
  • Historical data visualization
  • Cloud-based alert evaluation
  • Scalability for multiple devices

By isolating the Firebase client functions from core measurement routines, the firmware remains adaptable for future platform expansion without modifying the energy calculation engine.

Relay Control Logic (Threshold-Based Warning System)

Instead, a threshold-based warning mechanism is implemented.

When:

Energy ≥ Configured Limit
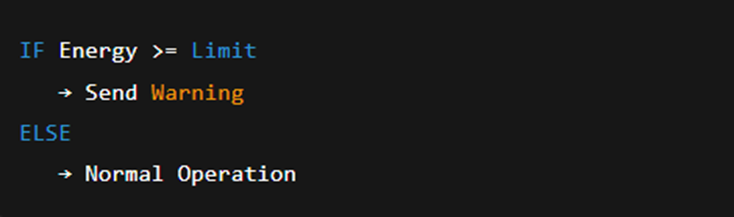
image.png

The system will:

· Set an alert flag in Firebase

· Display warning information on the LCD

· Trigger remote notification via the cloud layer

The load remains active unless manually switched OFF.

This design choice improves safety and avoids unintended service interruption while still providing preventive energy monitoring.

Design Lessons

Accurate kWh monitoring is not only about measuring voltage and current. It requires:

  • Stable communication
  • Robust error handling
  • Persistent data logic
  • Proper integration between measurement and cloud layer

This firmware architecture became the backbone for the multi-socket and advanced IoT versions developed afterward.

#Embedded# #ESP32# #iot# #internet of things# #firebase# #kwh meter#

IoT Project
Hardware Architecture of My IoT-Based Single-Socket kWh Energy Monitoring System

Monitoring electrical energy consumption at the socket level provides valuable insight into real-time power usage, cost estimation, and load behavior. In this project, I designed a single-socket IoT-based kWh monitoring system capable of measuring voltage, current, power, and accumulated energy, while transmitting data over WiFi for remote monitoring.

This first version focuses on a compact single-output architecture using ESP32 and a PZEM-based energy measurement module.

image.png

System Overview

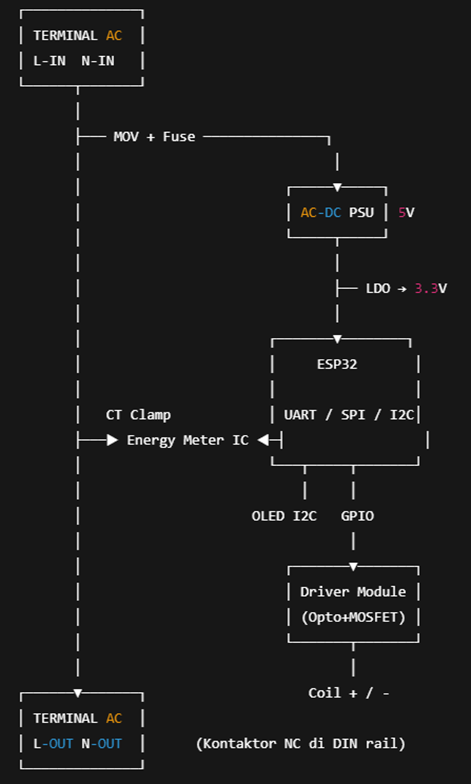
The hardware consists of the following main blocks:

  • ESP32 microcontroller (main controller with WiFi)
  • PZEM-004T energy measurement module
  • AC-DC power supply (220VAC to 5VDC)
  • High-power relay for load control
  • LCD 16x2 display for local monitoring
  • Terminal block for AC input/output

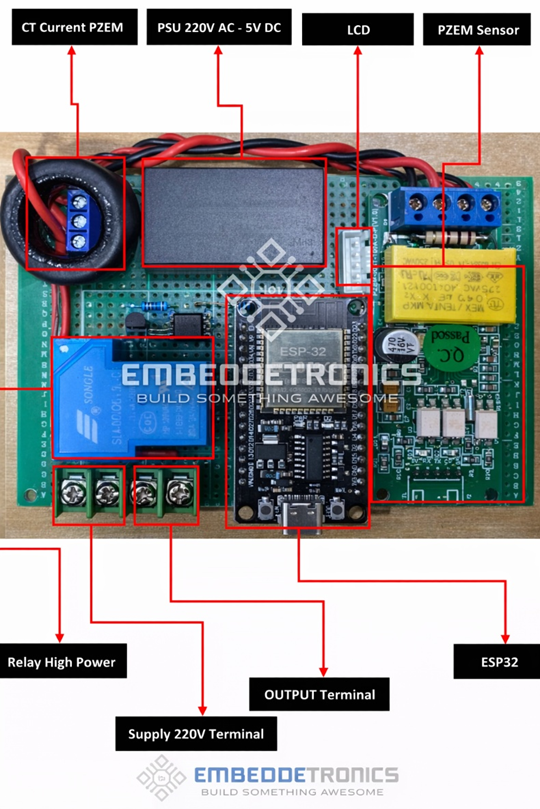
The internal board layout and power separation can be seen in the device assembly documentation:

image.png

Energy Measurement Module

For accurate measurement of voltage, current, power, and accumulated energy (kWh), I used the PZEM-004T module. This module simplifies high-voltage measurement because it provides built-in isolation between the AC line and the low-voltage microcontroller side.

Key specifications include:

  • Voltage measurement up to 260VAC
  • Current measurement up to 100A (using CT)
  • Frequency range 45–65Hz

Using a dedicated metering module reduces ADC complexity and improves reliability compared to raw analog sensing.

Power Supply and Isolation

The system operates from a 220VAC input. A compact AC-DC converter module steps down the voltage to 5VDC, which powers the ESP32, relay driver, and LCD.

Important hardware considerations:

  • Clear separation between high-voltage AC section and low-voltage logic section
  • Proper terminal block insulation
  • Short wiring between PSU and ESP32
  • Adequate spacing to reduce electrical noise

Even in prototype form (matrix board), I ensured physical separation between AC terminals and control circuitry to minimize risk and interference.

Load Control Section

A high-power relay is used to control the socket output. The relay allows:

  • Remote ON/OFF switching
  • Automatic cut-off based on energy limit
  • Integration with IoT platforms for smart control

The relay driver circuit includes proper transistor switching and flyback protection to ensure ESP32 safety.

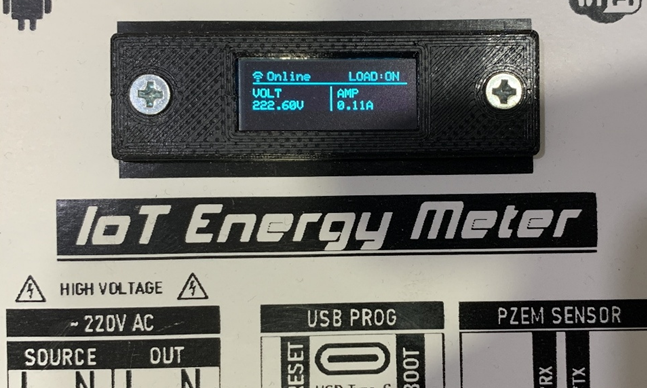
Local Monitoring Interface

A 16x2 LCD is used to display:

  • Voltage (V)
  • Current (A)
  • Power (W)
  • Energy (kWh)

image.png

This ensures the device remains functional even without internet connectivity.

Design Lessons

Designing an AC-powered IoT device requires careful attention to isolation, grounding, and layout discipline. Even small wiring mistakes can introduce noise into measurement readings.

Although this version was built as a prototype, migrating to a properly manufactured PCB would significantly improve safety, signal integrity, and long-term reliability.

This single-socket design became the foundation for more advanced multi-socket and cloud-integrated versions developed later.

#Embedded# #ESP32# #PZEM# #Energy Monitor#

IoT Project
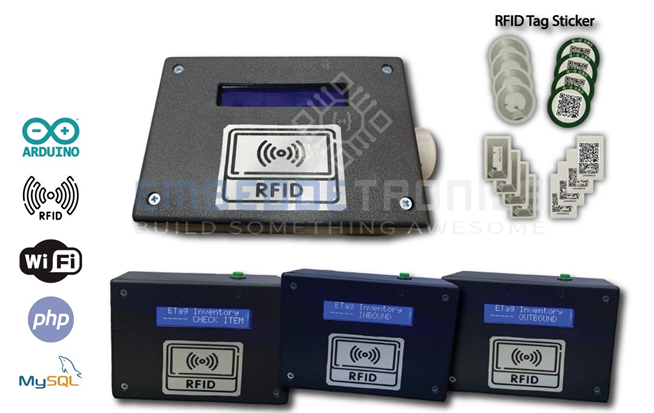
Designing an IoT-Based RFID Inventory Management System Using ESP Module and RC522

image.png

This project presents the development of an IoT-based RFID Inventory Management System designed for real-time inbound, outbound, and stock checking processes. The system integrates an ESP32 microcontroller with an MFRC522 RFID reader module and communicates directly with a web-based inventory platform via WiFi.

System Architecture

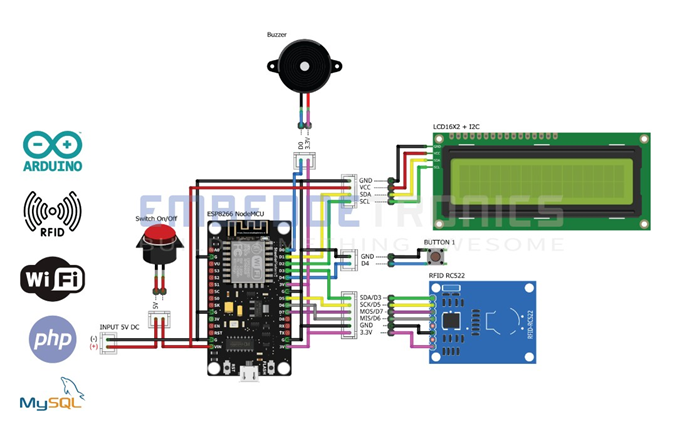
The core controller is the ESP32, selected for its built-in WiFi capability, dual-core processing, and stable SPI communication. The MFRC522 RFID module operates at 13.56 MHz and communicates with the ESP8266/ESP32 through SPI (SDA, SCK, MOSI, MISO, RST).

Additional peripherals include:

  • 16x2 LCD with I2C interface
  • Push button for mode selection
  • Buzzer for audio feedback
  • 5V regulated power supply

image.png

The wiring configuration where RFID, LCD, Button, and Buzzer are clearly mapped to the ESP board pins.

Operating Modes

The device supports three main modes selectable via a single push button:

  1. Inbound Mode – Register new tagged items into the system
  2. Outbound Mode – Record item removal from inventory
  3. Check Item Mode – Display item details without modifying stock

The LCD interface provides clear status feedback such as INBOUND, OUTBOUND, and CHECK ITEM, while the buzzer confirms successful tag detection.

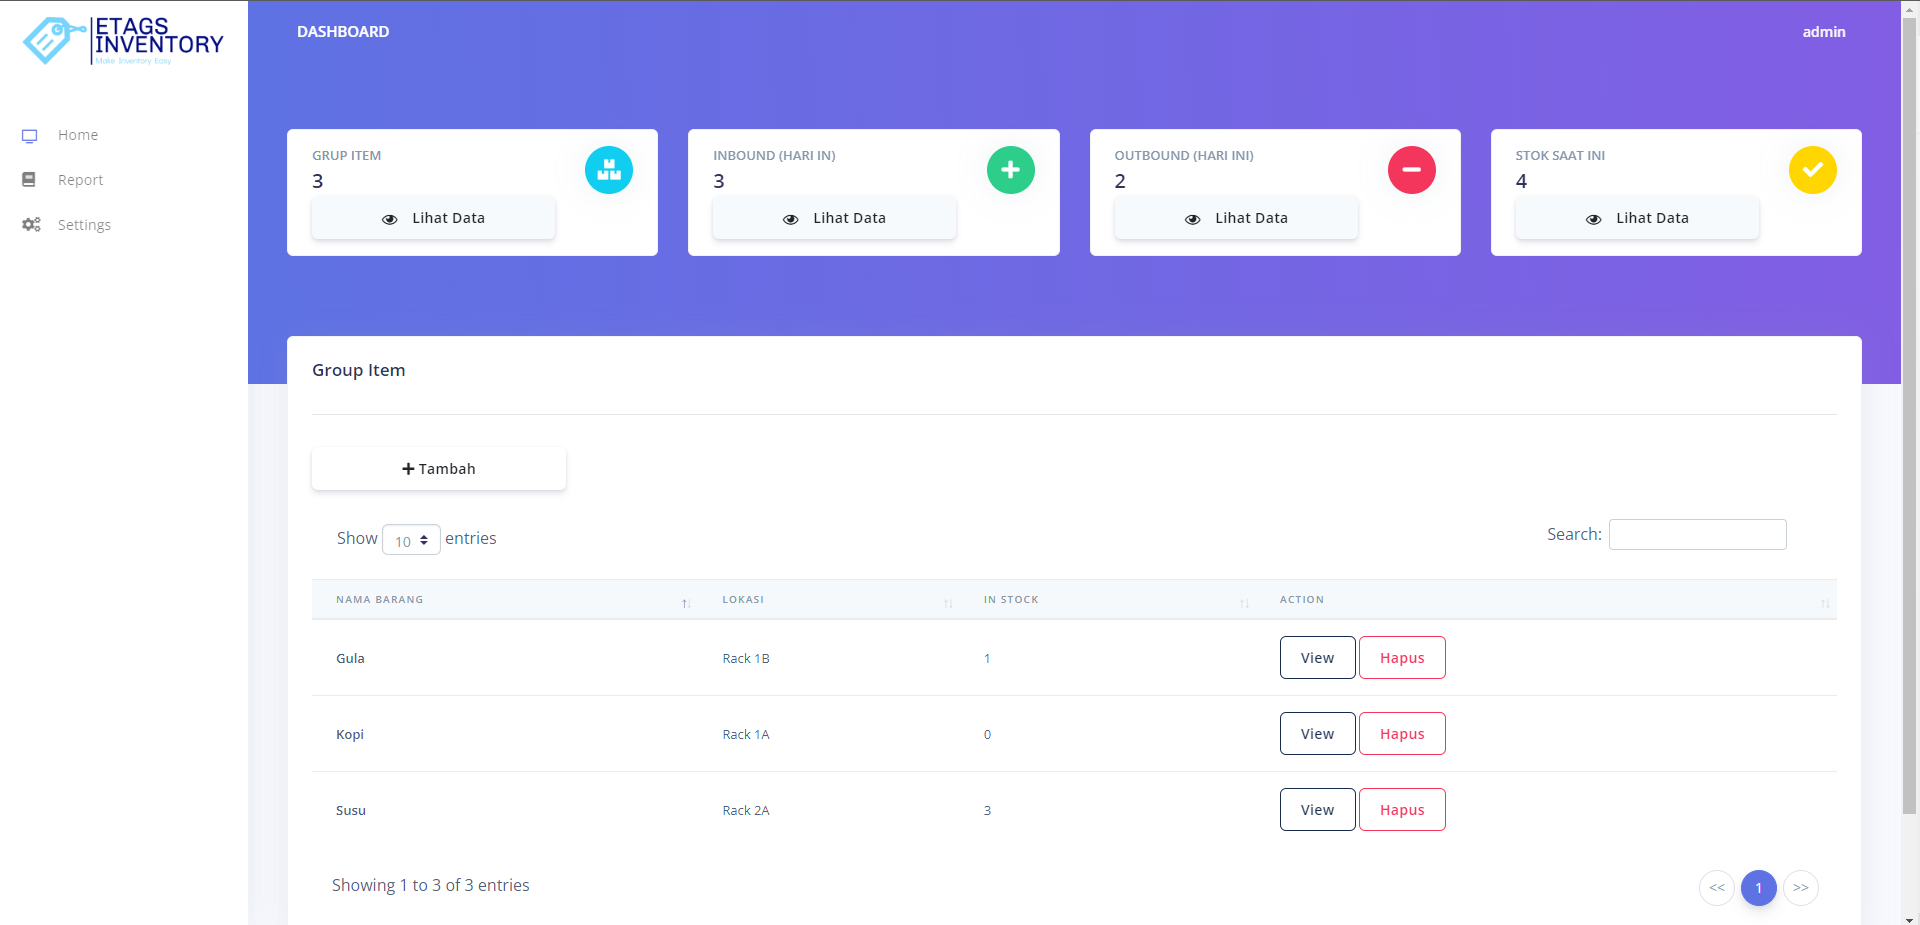
Web Integration & Database

Home_web_Screenshot 2023-07-29 171357.png

The system connects to a local or cloud-based web server. The backend can be deployed using XAMPP with Apache and MySQL.

Data flow sequence:

  1. RFID tag scanned
  2. UID captured by ESP
  3. HTTP request sent to server (with device ID & token)
  4. Database updated in real-time
  5. Web dashboard displays transaction log

The web interface allows:

  • Device configuration
  • Item group management
  • Real-time inbound/outbound logs
  • Report export to Excel

Hardware Implementation

After successful breadboard prototyping, the circuit was assembled onto a perforated PCB and enclosed in a custom black panel box. The enclosure integrates:

  • Front LCD window
  • RFID scan area
  • Rear 5V adapter input
  • Power switch

The final device is compact, stable, and ready for industrial or laboratory environments.

#ESP32# #Embedded# #RFID# #inventory# #warehouse#

IoT Project
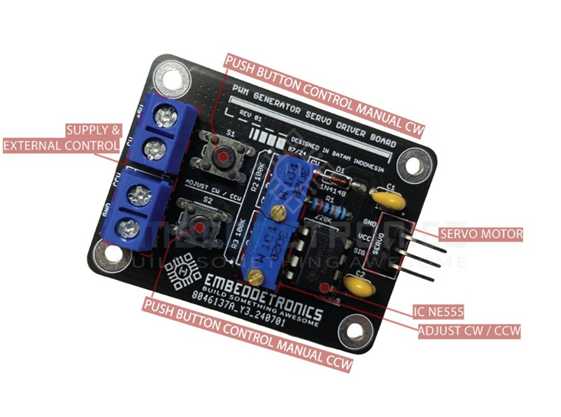
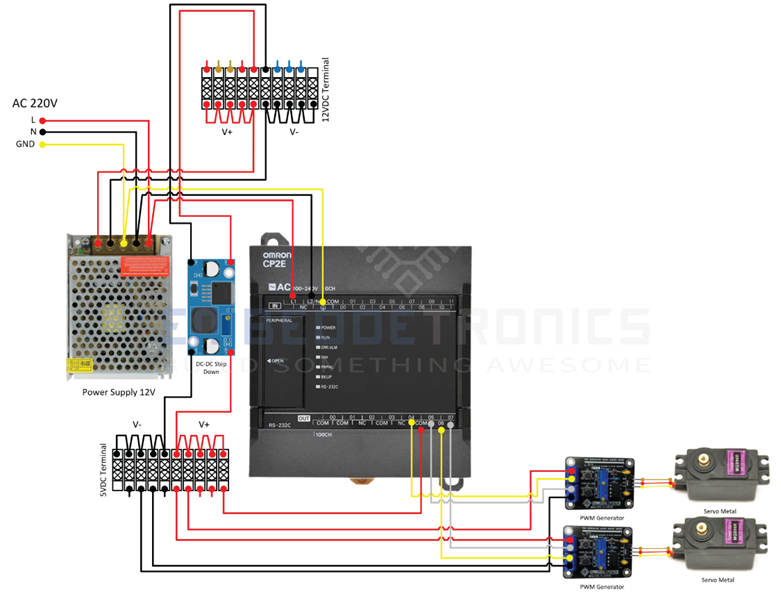
From Prototype to Production: PWM Generator & Servo Driver for Non-PWM PLC

image.png

In many industrial systems, not all PLC models provide native PWM output. When PWM expansion modules are available, they are often expensive and unnecessary for simple positioning tasks.

I needed to control a low-voltage servo (MG996R, 5–6V) using a standard 24V PLC digital output. Since the PLC did not support PWM, I decided to design a dedicated PWM Generator & Servo Driver board as a cost-effective solution.

Prototype Phase

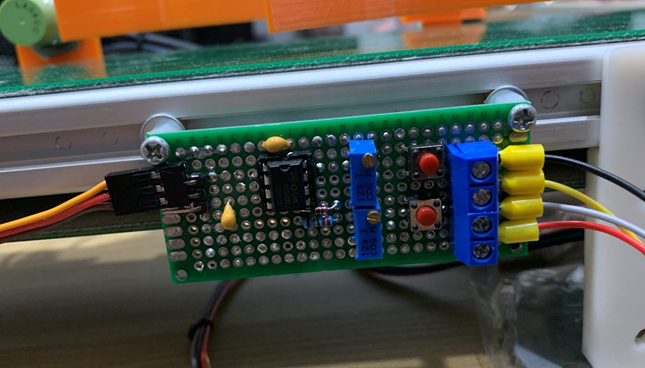
image.png

The first version was built using a perforated prototype PCB.

The goal was to validate:

  • 12V/24V PLC signal compatibility
  • Servo movement stability

After several adjustments, the prototype worked reliably. The servo response was smooth and consistent under normal load conditions. Once the concept was proven, I decided to redesign the circuit into a proper PCB.

PCB Design & Fabrication

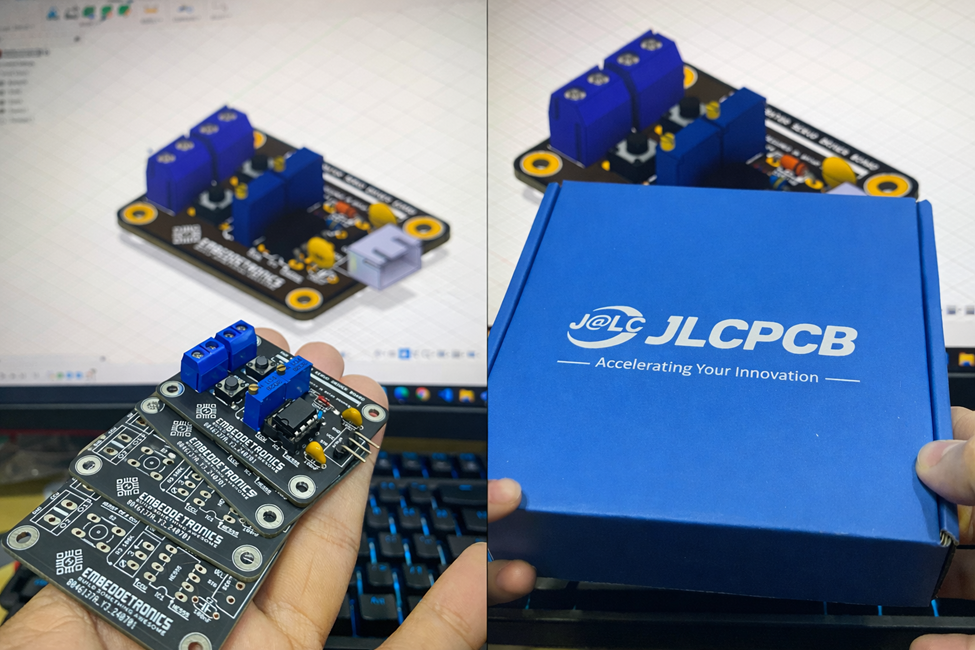
image.png

The circuit was redesigned into a 2-layer PCB for:

  • Cleaner routing
  • Better power distribution
  • Reduced noise
  • More professional mechanical structure

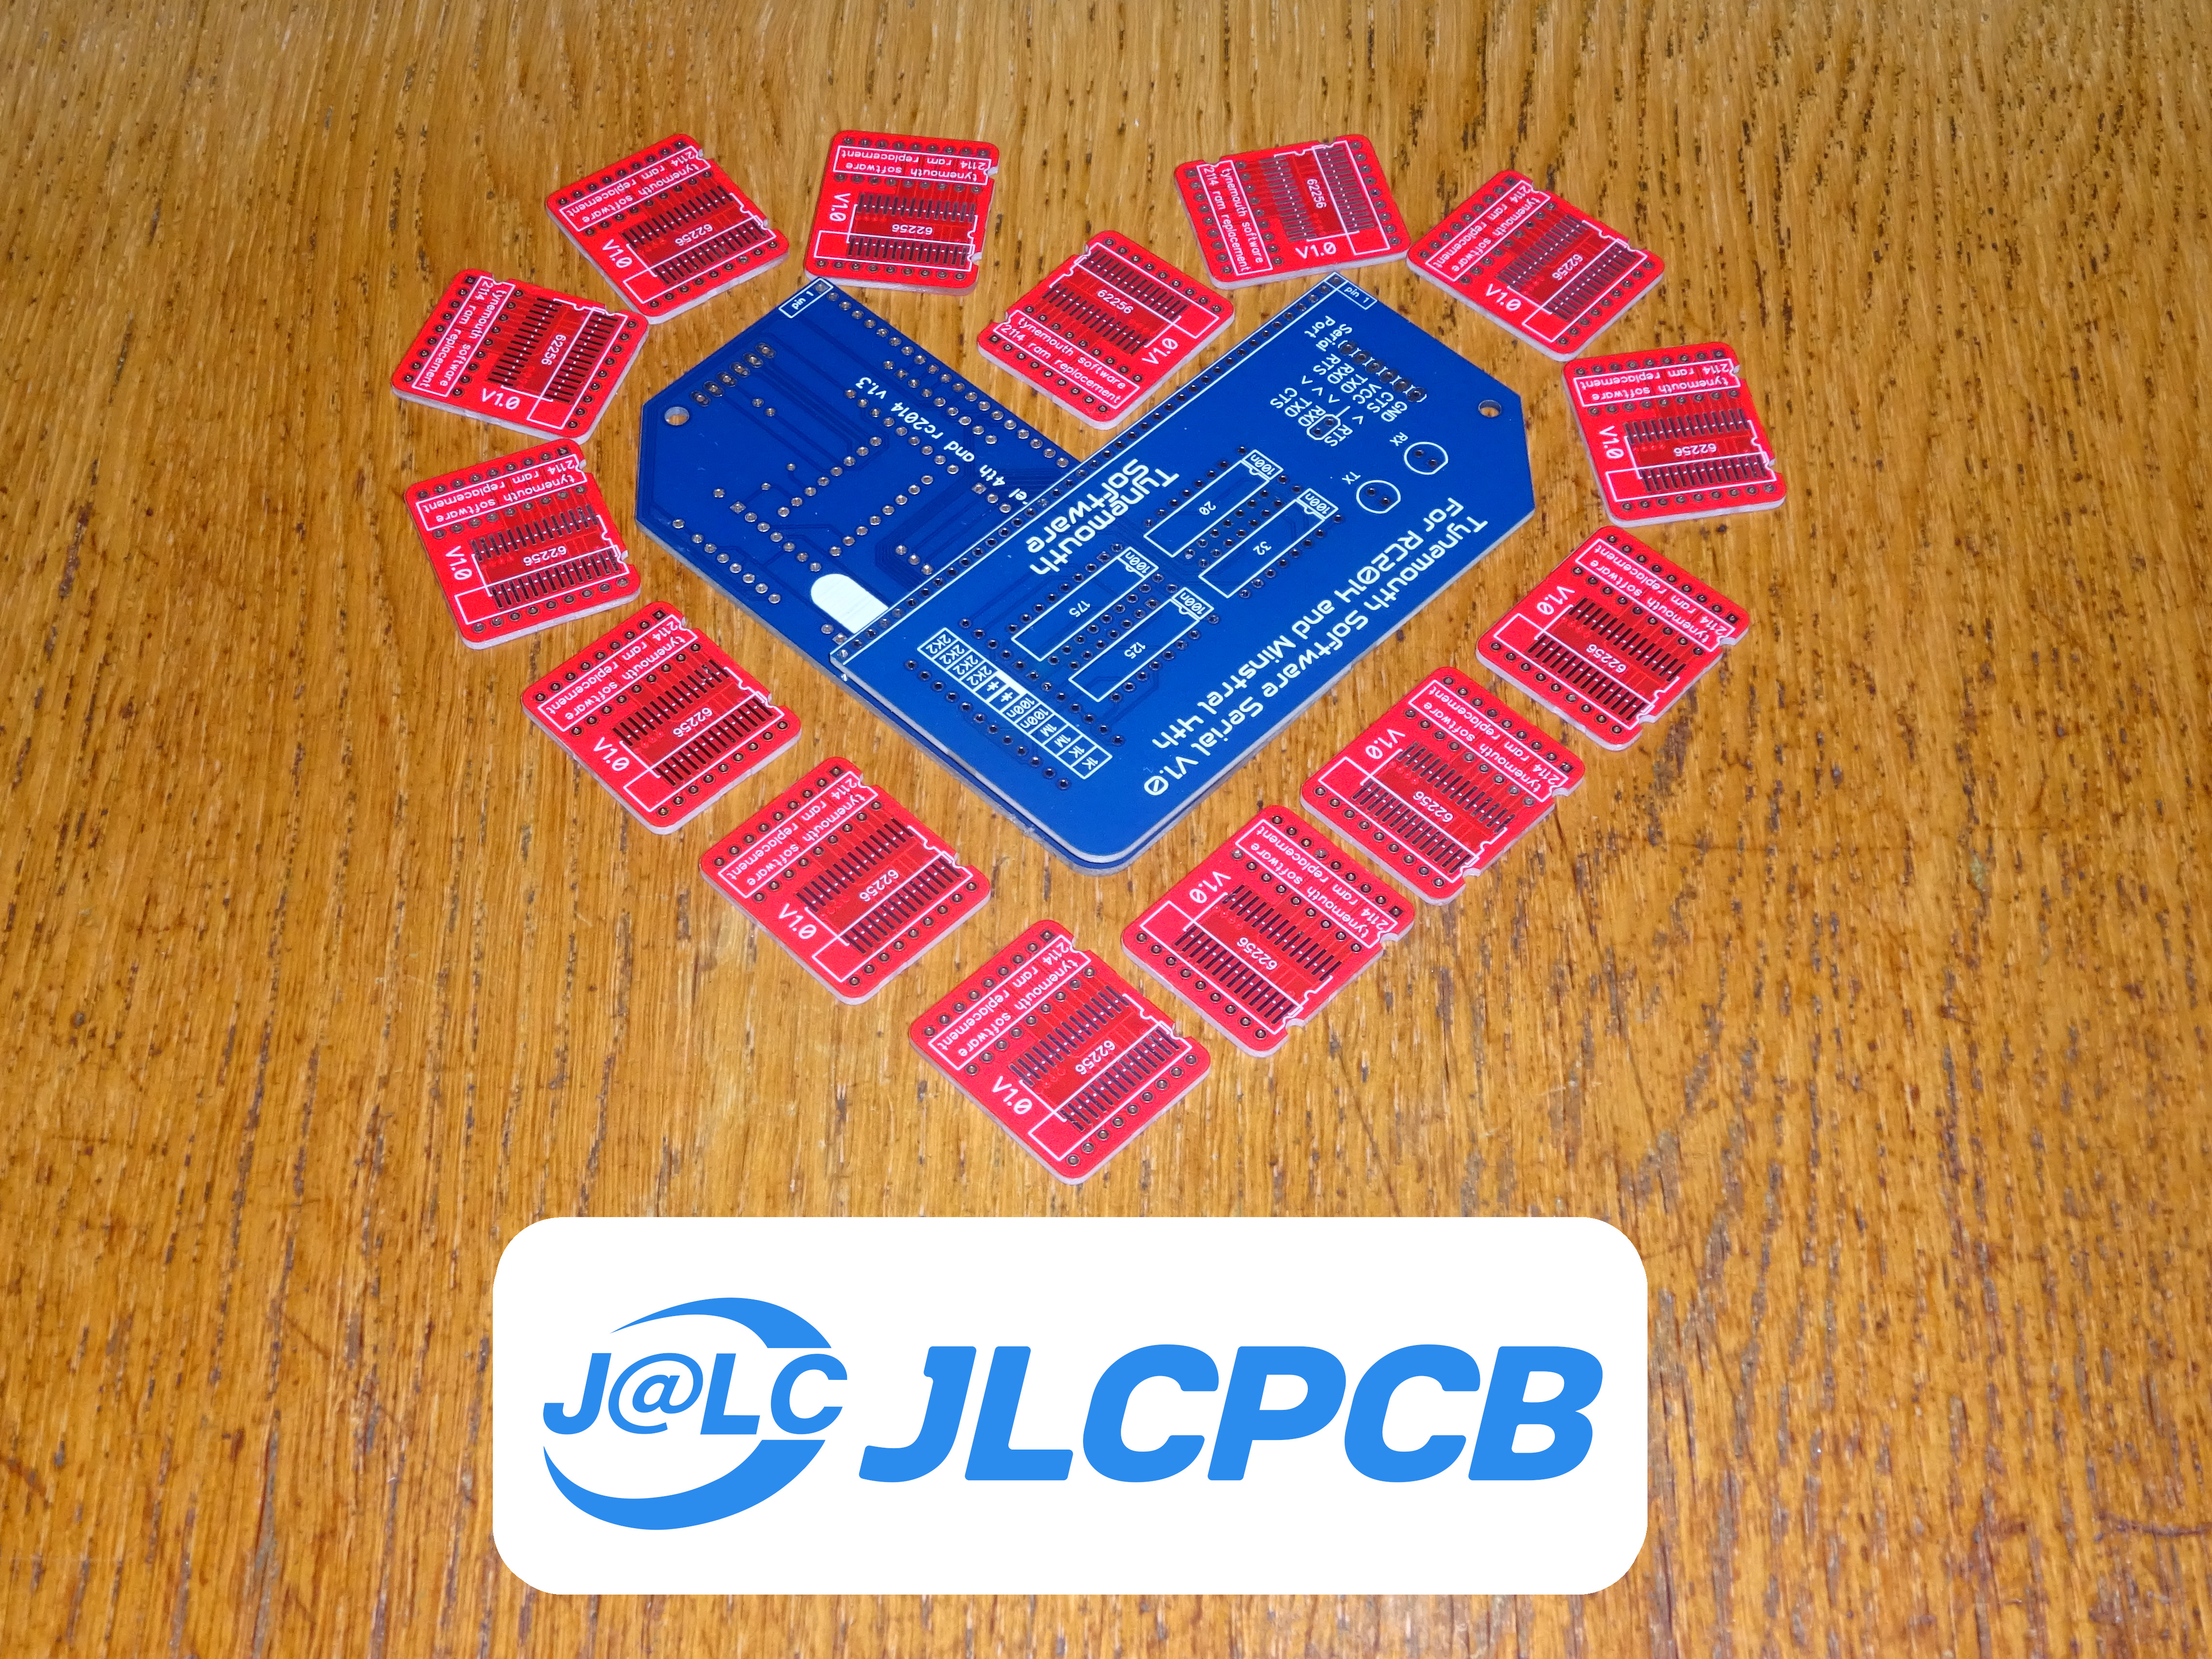
The PCB was fabricated using JLCPCB. The board quality was excellent, with accurate drilling, clean copper traces, and clear silkscreen. The compact layout also improved reliability compared to the prototype version.

Small Batch Production

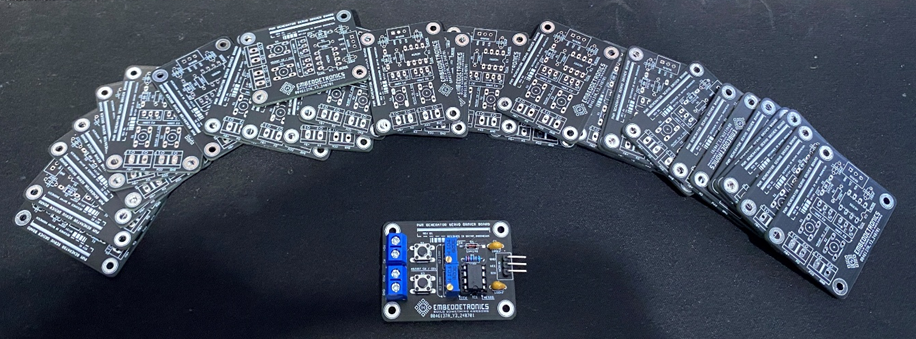
image.png

After testing the first PCB batch, I proceeded with small-scale production of 30 units. These boards were used for real application testing and market validation.

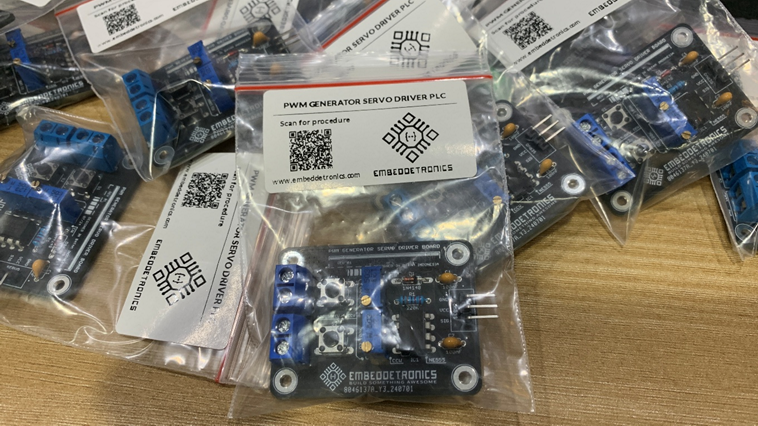
image.png

The system successfully enables standard PLC digital outputs (12V/24V) to control low-voltage servo motors without needing an expensive PLC PWM module.

Technical Overview

System flow:

PLC 12V/24V Digital Output

→ Signal Conditioning

→ PWM Generator

→ 5–6V Servo Driver

→ MG996R Servo

image.png

Main features:

  • 12V/24V PLC compatible input
  • Stable 50Hz servo PWM
  • 1–2ms adjustable pulse width
  • Compact 2-layer PCB

This project started from a simple prototype on a perforated board and evolved into a small production run using JLCPCB.

It demonstrates how custom PCB design can provide a practical and economical solution for PLC systems without built-in PWM functionality.

#PCB# #Module# #PWM# #PCBDesign# #SERVO# #PLC#

Build with JLCPCB
Comparing PCB Etching Techniques

【What is PCB Etching?】

In short, etching is the chemical or physical process of removing unwanted copper from a substrate to reveal your designed circuit pattern. It’s the "make or break" step in PCB manufacturing.

【Top 3 Etching Techniques Compared】

  1. Wet Etching (The Industry Standard) 🧪
    • How it works: Uses chemical solutions (Acidic or Alkaline) to dissolve excess copper.
    • Pros: Cost-effective, high speed, perfect for mass production.
    • Cons: Risks "undercutting" (sideways etching), which can limit fine-line precision.
    • Best for: Standard boards and inner layer circuits.
  2. Dry / Plasma Etching (The Precision Play) ⚡
    • How it works: Uses plasma gases in a vacuum to bombard the surface.
    • Pros: Exceptional precision with zero liquid waste; no "undercutting" issues.
    • Cons: Expensive equipment and slower throughput.
    • Best for: High-density interconnect (HDI) boards and ultra-fine designs.
  3. Laser Etching (The Clean Alternative) 🎯
    • How it works: A high-energy laser beam "evaporates" copper directly.
    • Pros: No chemicals needed; highly flexible for rapid prototyping.
    • Cons: Not suitable for large-scale production due to cost and time.

【3 Tips for Engineers to Avoid Failure】

  • Mind the Undercut: Account for "Etch Factor" in your design to ensure your trace width remains accurate after chemical processing.
  • Surface Preparation: Even a fingerprint can cause etching defects—cleanliness is key!
  • Post-Etch Care: Ensure thorough rinsing and immediate surface finishing (like HASL or ENIG) to prevent copper oxidation.

Join the Conversation:

When designing high-speed circuits, which factor do you prioritize more: production cost or trace edge precision? Let’s discuss in the comments!

#PCBDesign #ElectronicsEngineering #HardwareDesign #JLCPCB #Manufacturing #TechTips

#PCB##JLCPCB#

PCB